Satellite Embedding Deep Dive (Full Workshop)
A hands-on workshop for working with the Satellite Embedding dataset in Google Earth Engine.
Ujaval Gandhi
Introduction
Google Satellite Embedding Dataset is a global dataset of pre-computed, analysis-ready geospatial embeddings for each year from 2017 onwards. This dataset was produced by Google DeepMind’s AlphaEarth Foundations model and presents a big leap in making remote sensing and climate datasets useful. Along with making existing remote sensing workflows more efficient, this dataset unlocks a range of new use cases. This workshop is designed to help you get started with the dataset in GEE and use it for a variety of applications.

Setting up the Environment
Sign-up for Google Earth Engine
If you already have a Google Earth Engine account, you can skip this step.
Visit our GEE Sign-Up Guide for step-by-step instructions.
Get the Workshop Materials
The workshop material and exercises are in the form of Earth Engine scripts shared via a code repository.
- Click this link to open Google Earth Engine code editor and add the repository to your account.
- If successful, you will have a new repository named
users/ujavalgandhi/GEE-Satellite-Embeddingin the Scripts tab in the Reader section.
If you do not see the repository in the Reader section, click Refresh repository cache button in your Scripts tab and it will show up.
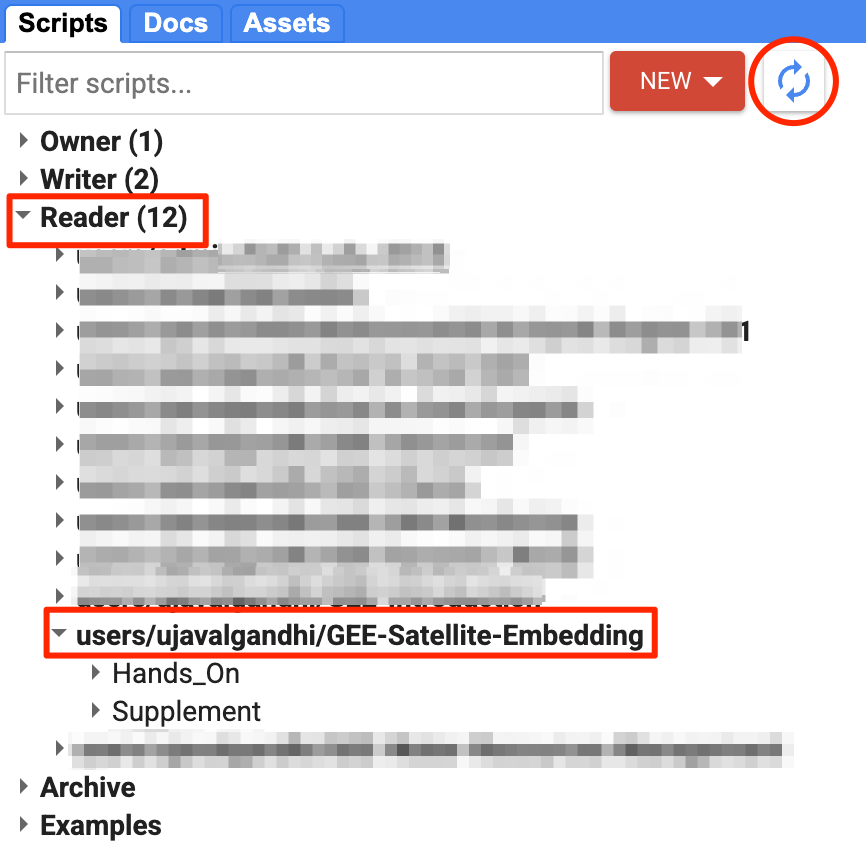
Workshop Repository
Get the Workshop Video
The course is accompanied by a video covering the all the sections. This video is recorded from our live webinar class and is edited to make them easier to consume for self-study. We have 2 versions of the videos:
YouTube
The video on YouTube is ideal for online learning and sharing. You may also turn on Subtitles/closed-captions and adjust the playback speed to suit your preference. Access the YouTube Video ↗
Vimeo
We have also made full-length video available on Vimeo. This video can be downloaded for offline learning. Access the Vimeo Video ↗
Hands-on With Satellite Embedding Dataset
01. Visualizing Embeddings
Visualizing a satellite embedding image with 3 clusters
// Visualizing the Satellite Embedding Dataset
// ****************************************************

// Select a region
// ****************************************************
var geometry = ee.Geometry.Polygon([[
  [76.39785, 12.5521],
  [76.39785, 12.3550],
  [76.65191, 12.3550],
  [76.65191, 12.5521]
]]);

// Use the satellite basemap
Map.setOptions('SATELLITE');

// Draw a polygon to define the region
// Save it as the variable 'geometry'
Map.centerObject(geometry, 12);

// Prepare the Satellite Embedding dataset
// ****************************************************

var embeddings = ee.ImageCollection('GOOGLE/SATELLITE_EMBEDDING/V1/ANNUAL');
var year = 2024;
var startDate = ee.Date.fromYMD(year, 1, 1);
var endDate = startDate.advance(1, 'year');

var filteredEmbeddings = embeddings
  .filter(ee.Filter.date(startDate, endDate))
  .filter(ee.Filter.bounds(geometry));

var embeddingsImage = filteredEmbeddings.mosaic();

print('Satellite Embeddings Image', embeddingsImage);

// Visualize the Satellite Embedding Dataset
// *********************************************************

// Visualize three axes of the embedding space as an RGB.
var visParams = {min: -0.3, max: 0.3, bands: ['A01', 'A16', 'A09']};
Map.addLayer(embeddingsImage.clip(geometry), visParams, 'Embeddings Image');

// Make the training dataset for unsupervised clustering
var nSamples = 1000;
var training = embeddingsImage.sample({
  region: geometry,
  scale: 10,
  numPixels: nSamples,
  seed: 100
});
print(training.first());

// Function to train a model for desired number of clusters
var getClusters = function(nClusters) {
  var clusterer = ee.Clusterer.wekaKMeans({nClusters: nClusters})
    .train(training);

  // Cluster the image
  var clustered = embeddingsImage.cluster(clusterer);
  return clustered;
};

var cluster3 = getClusters(3);
Map.addLayer(cluster3.randomVisualizer().clip(geometry), {}, ' 3 clusters');

var cluster5 = getClusters(5);
Map.addLayer(cluster5.randomVisualizer().clip(geometry), {}, ' 5 clusters');

var cluster10 = getClusters(10);
Map.addLayer(cluster10.randomVisualizer().clip(geometry), {}, ' 10 clusters');
Exercise
// Exercise

// Delete the geometry
// Draw a geometry for your region of interest
// Try visualizing the embeddings with different bands (A01, A02, A03...)
// Try changing the number of clusters to see different levels of detail
02. Crop Type Mapping
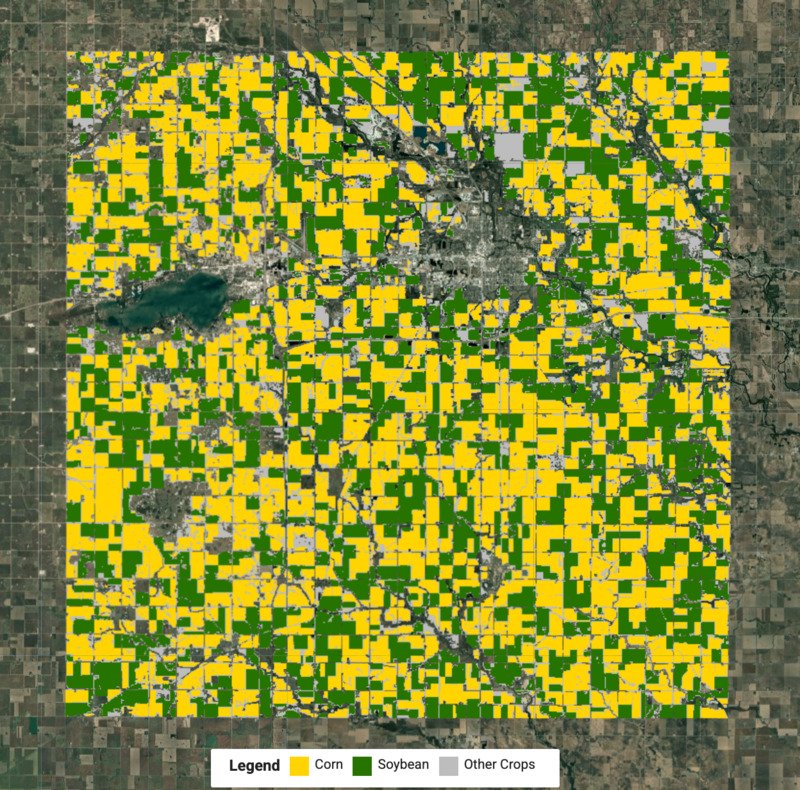
Detected Crop Type Map using Unsupervised Classification
// Unsupervised Clustering with Satellite Embeddings
// Crop Type Mapping
// ****************************************************

// Select the region
// ****************************************************

// Cerro Gordo County, Iowa
var counties = ee.FeatureCollection('TIGER/2018/Counties');

var selected = counties
  .filter(ee.Filter.eq('GEOID', '19033'));
var geometry = selected.geometry();
Map.centerObject(geometry, 12);
Map.setOptions('SATELLITE');

Map.addLayer(geometry, {color: 'red'}, 'Selected Region', false);

// Prepare the Satellite Embedding dataset
// ****************************************************

var embeddings = ee.ImageCollection('GOOGLE/SATELLITE_EMBEDDING/V1/ANNUAL');

var year = 2022;
var startDate = ee.Date.fromYMD(year, 1, 1);
var endDate = startDate.advance(1, 'year');

var filteredembeddings = embeddings
  .filter(ee.Filter.date(startDate, endDate))
  .filter(ee.Filter.bounds(geometry));

var embeddingsImage = filteredembeddings.mosaic();


// Visualize three axes of the embedding space as an RGB.
var visParams = {min: -0.3, max: 0.3, bands: ['A01', 'A16', 'A09']};
Map.addLayer(embeddingsImage.clip(geometry), visParams, 'Embeddings Image');

// Create a Cropland Mask
// ****************************************************

// Use Cropland Data Layers (CDL) to obtain cultivated cropland
var cdl = ee.ImageCollection('USDA/NASS/CDL')
  .filter(ee.Filter.date(startDate, endDate))
  .first();
var cropLandcover = cdl.select('cropland');
var croplandMask = cdl.select('cultivated').eq(2).rename('cropmask');

// Visualize the crop mask
var croplandMaskVis = {min:0, max:1, palette: ['white', 'green']};
Map.addLayer(croplandMask.clip(geometry), croplandMaskVis, 'Crop Mask', false);

// Extract Training Samples
// ****************************************************

// Mask all non-cropland pixels
var clusterImage = embeddingsImage.updateMask(croplandMask);
Map.addLayer(clusterImage.clip(geometry), visParams,
  'Embeddings Image (with Crop Mask)', false);

// We need to extract well distributed training samples
// for all target crops in the county

// Stratified random sampling to ensure we get desired
// number of samples exluding the masked pixels
var training = clusterImage.addBands(croplandMask).stratifiedSample({
  numPoints: 1000,
  classBand: 'cropmask',
  region: geometry,
  scale: 10,
  tileScale: 16,
  seed: 100,
  dropNulls: true,
  geometries: true
});

// ~~~~~~~~~~~~~~~~~~~~~~~~~~~~~~~~~~~~~~~~~~~~~~~~~~~~
// Export samples to an asset (optional)
// ~~~~~~~~~~~~~~~~~~~~~~~~~~~~~~~~~~~~~~~~~~~~~~~~~~~~

// Replace this with your asset folder
// The folder must exist before exporting
var exportFolder = 'projects/spatialthoughts/assets/satellite_embedding/';

var samplesExportFc = 'cluster_training_samples';
var samplesExportFcPath = exportFolder + samplesExportFc;

Export.table.toAsset({
  collection: training,
  description: 'Cluster_Training_Samples',
  assetId: samplesExportFcPath
});

// Wait for the export to complete and continue with
// the exported asset from here onwards.

// Use the exported asset
var training = ee.FeatureCollection(samplesExportFcPath);

// ~~~~~~~~~~~~~~~~~~~~~~~~~~~~~~~~~~~~~~~~~~~~~~~~~~~~
// End optional export section
// ~~~~~~~~~~~~~~~~~~~~~~~~~~~~~~~~~~~~~~~~~~~~~~~~~~~~

// Visualize the samples
// ****************************************************
print('Extracted sample', training.first());
Map.addLayer(training, {color: 'blue'}, 'Extracted Samples', false);

// Perform Unsupervised Clustering
// ****************************************************

var minClusters = 4;
var maxClusters = 5;

var clusterer = ee.Clusterer.wekaCascadeKMeans({
  minClusters:minClusters, maxClusters: maxClusters}).train({
  features: training,
  inputProperties: clusterImage.bandNames()
});

var clustered = clusterImage.cluster(clusterer);
Map.addLayer(clustered.randomVisualizer().clip(geometry), {}, 'Clusters', false);

// Assign Labels to Clusters
// ****************************************************

// Calculate Cluster Areas
// 1 Acre = 4046.86 Sq. Meters
var areaImage = ee.Image.pixelArea().divide(4046.86).addBands(clustered);

var areas = areaImage.reduceRegion({
      reducer: ee.Reducer.sum().group({
      groupField: 1,
      groupName: 'cluster',
    }),
    geometry: geometry,
    scale: 10,
    maxPixels: 1e10
    });

var clusterAreas = ee.List(areas.get('groups'));

// Process results to extract the areas and create a FeatureCollection

var clusterAreas = clusterAreas.map(function(item) {
  var areaDict = ee.Dictionary(item);
  var clusterNumber = areaDict.getNumber('cluster').format();
  var area = areaDict.getNumber('sum');
  return ee.Feature(null, {cluster: clusterNumber, area: area});
});

var clusterAreaFc = ee.FeatureCollection(clusterAreas);
print('Cluster Areas', clusterAreaFc);

// This region has 2 primary crops - corn and soybean
// Pick the 2 clusters with the highest area
var selectedFc = clusterAreaFc.sort('area', false).limit(2);
print('Top 2 Clusters by Area', selectedFc);


// We do not know which is what crops
// Use the crop statistics and match those areas
// Cerro Gordo County, Iowa
// Corn statistics https://www.nass.usda.gov/Statistics_by_State/Iowa/Publications/County_Estimates/2023/IA-CtyEst-Corn-02-23.pdf
// Soybean statistics https://www.nass.usda.gov/Statistics_by_State/Iowa/Publications/County_Estimates/2023/IA-CtyEst-Soybeans-02-23.pdf
// Corn Area: 163,500 Acres
// Soybean Area: 110,500 Acres

// From the 2 clusters, the one with the highest area is 'Corn'
// Other is Soybean
var cornFeature = selectedFc.sort('area', false).first();
var soybeanFeature = selectedFc.sort('area').first();
var cornCluster = cornFeature.get('cluster');
var soybeanCluster = soybeanFeature.get('cluster');

print('Corn Area (Detected)', cornFeature.getNumber('area').round());
print('Corn Area (From Crop Statistics)', 163500);

print('Soybean Area (Detected)', soybeanFeature.getNumber('area').round());
print('Soybean Area (From Crop Statistics)', 110500);

// Create a Crop Map
// ****************************************************

// Select the clusters to create the crop map
var corn = clustered.eq(ee.Number.parse(cornCluster));
var soybean = clustered.eq(ee.Number.parse(soybeanCluster));

// Visualize the final output
var merged = corn.add(soybean.multiply(2));
var cropVis = {min:0, max:2, palette: ['#bdbdbd', '#ffd400', '#267300']};

Map.addLayer(merged.clip(geometry), cropVis, 'Crop Map (Detected)');

// Add a Legend
var legend = ui.Panel({
  layout: ui.Panel.Layout.Flow('horizontal'),
  style: {position: 'bottom-center', padding: '8px 15px'}});

var addItem = function(color, name) {
  var colorBox = ui.Label({
    style: {color: '#ffffff',
      backgroundColor: color,
      padding: '10px',
      margin: '0 4px 4px 0',
    }
  });
  var description = ui.Label({
    value: name,
    style: {
      margin: '0px 10px 0px 2px',
    }
  });
  return ui.Panel({
    widgets: [colorBox, description],
    layout: ui.Panel.Layout.Flow('horizontal')}
)};

var title = ui.Label({
  value: 'Legend',
  style: {fontWeight: 'bold',
    fontSize: '16px',
    margin: '0px 10px 0px 4px'}});

legend.add(title);
legend.add(addItem('#ffd400', 'Corn'));
legend.add(addItem('#267300', 'Soybean'));
legend.add(addItem('#bdbdbd', 'Other Crops'));

Map.add(legend);

// Validate the results
// ****************************************************

// Compare our results with the crop type map from CDL
var cdl = ee.ImageCollection('USDA/NASS/CDL')
  .filter(ee.Filter.date(startDate, endDate))
  .first();
var cropLandcover = cdl.select('cropland');
var cropMap = cropLandcover.updateMask(croplandMask).rename('crops');

// Original data has unique values for each crop ranging from 0 to 254
var cropClasses = ee.List.sequence(0, 254);
// We remap all values as following
// Crop     | Source Value | Target Value
// Corn     | 1            | 1
// Soybean  | 5            | 2
// All other| 0-255        | 0
var targetClasses = ee.List.repeat(0, 255).set(1, 1).set(5, 2);
var cropMapReclass = cropMap.remap(cropClasses, targetClasses).rename('crops');

var cropVis = {min: 0, max: 2, palette: ['#bdbdbd', '#ffd400', '#267300']};
Map.addLayer(cropMapReclass.clip(geometry), cropVis, 'Crop Landcover (CDL)');
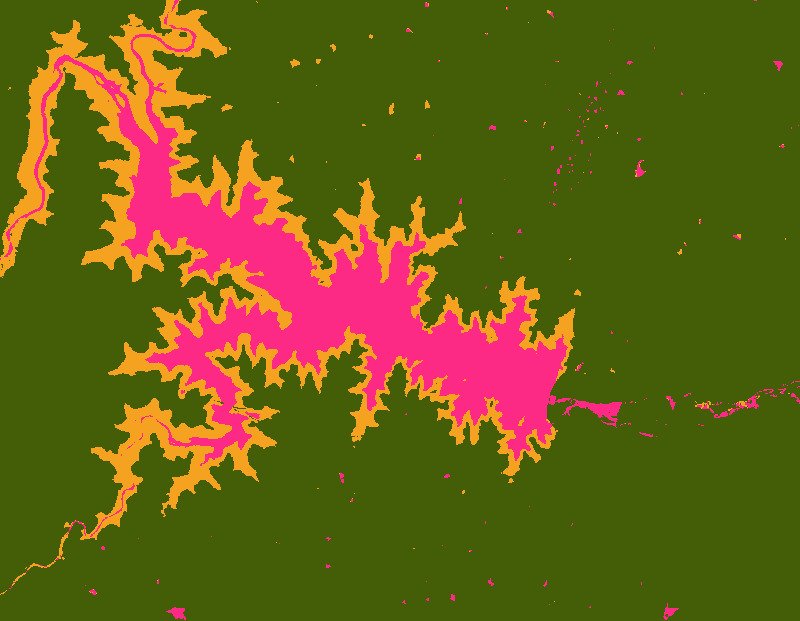
Exercise
Crop Mapping Exercise with Satellite Embedding
// Exercise: Crop Type Mapping
// ****************************************************
// Select the region
// ****************************************************
var geometry = ee.Geometry.Polygon([[
[83.6180, 21.43577],
[83.6180, 21.26181],
[83.8391, 21.26181],
[83.8391, 21.43577]
]]);
Map.centerObject(geometry, 12);
Map.setOptions('SATELLITE');
Map.addLayer(geometry, {color: 'red'}, 'Selected Region', false);
// Prepare the Satellite Embedding dataset
// ****************************************************
var embeddings = ee.ImageCollection('GOOGLE/SATELLITE_EMBEDDING/V1/ANNUAL');
var year = 2024;
var startDate = ee.Date.fromYMD(year, 1, 1);
var endDate = startDate.advance(1, 'year');
var filteredembeddings = embeddings
.filter(ee.Filter.date(startDate, endDate))
.filter(ee.Filter.bounds(geometry));
var embeddingsImage = filteredembeddings.mosaic();
// Visualize three axes of the embedding space as an RGB.
var visParams = {min: -0.3, max: 0.3, bands: ['A01', 'A16', 'A09']};
Map.addLayer(embeddingsImage.clip(geometry), visParams, 'Embeddings Image', false);
// Create a Cropland Mask
// ****************************************************
// Use ESA Worldcover cropland
// This dataset is from 2021 so there maybe a mismatch
// in cropland extent in recent years
var worldcover = ee.ImageCollection('ESA/WorldCover/v200');
var classification = worldcover.first();
var cropLandcover = classification.eq(40);
var croplandMask = cropLandcover.rename('cropmask');
// Visualize the crop mask
var croplandMaskVis = {min:0, max:1, palette: ['white', 'green']};
Map.addLayer(croplandMask.clip(geometry), croplandMaskVis, 'Crop Mask', false);
// Extract Training Samples
// ****************************************************
// Mask all non-cropland pixels
var clusterImage = embeddingsImage.updateMask(croplandMask);
Map.addLayer(clusterImage.clip(geometry), visParams,
'Embeddings Image (with Crop Mask)', false);
// We need to extract well distributed training samples
// for all target crops in the county
// Stratified random sampling to ensure we get desired
// number of samples exluding the masked pixels
var training = clusterImage.addBands(croplandMask).stratifiedSample({
numPoints: 1000,
classBand: 'cropmask',
region: geometry,
scale: 10,
tileScale: 16,
seed: 100,
dropNulls: true,
geometries: true
});
// Perform Unsupervised Clustering
// ****************************************************
var minClusters = 2;
var maxClusters = 5;
var clusterer = ee.Clusterer.wekaCascadeKMeans({
minClusters:minClusters, maxClusters: maxClusters}).train({
features: training,
inputProperties: clusterImage.bandNames()
});
var clustered = clusterImage.cluster(clusterer);
Map.addLayer(clustered.randomVisualizer().clip(geometry), {}, 'Clusters');
// Add Sentinel-2 NDVI Time-Series
// ****************************************************
var s2 = ee.ImageCollection('COPERNICUS/S2_HARMONIZED');
// Load the Cloud Score+ collection
var csPlus = ee.ImageCollection('GOOGLE/CLOUD_SCORE_PLUS/V1/S2_HARMONIZED');
var csPlusBands = csPlus.first().bandNames();
// We need to add Cloud Score + bands to each Sentinel-2
// image in the collection
// This is done using the linkCollection() function
var s2WithCs = s2.linkCollection(csPlus, csPlusBands);
// Function to mask pixels with low CS+ QA scores.
function maskLowQA(image) {
var qaBand = 'cs';
var clearThreshold = 0.5;
var mask = image.select(qaBand).gte(clearThreshold);
return image.updateMask(mask);
}
function addNDVI(image) {
var ndvi = image.normalizedDifference(['B8', 'B4']).rename('ndvi');
return image.addBands(ndvi);
}
// Function to create and display NDVI time-series chart
// when a point is clicked
function displayChart(point) {
chartPanel.clear();
var pointGeom = ee.Geometry.Point(point.lon, point.lat);
var filtered = s2WithCs
.filter(ee.Filter.date(startDate, endDate))
.map(maskLowQA)
.map(addNDVI)
.filter(ee.Filter.bounds(pointGeom));
var chart = ui.Chart.image.series({
imageCollection: filtered.select('ndvi'),
region: pointGeom,
reducer: ee.Reducer.mean(),
scale: 20}).setOptions({
title: 'NDVI Time Series',
vAxis: {title: 'NDVI', viewWindow: {min:0, max:1}},
hAxis: {title: 'Date', gridlines: {count: 12}},
interpolateNulls: true,
pointSize: 2,
lineWidth: 1
});
chartPanel.add(chart);
}
var chartPanel = ui.Panel({
style: {width: '400px', position: 'bottom-right'}
});
Map.add(chartPanel);
Map.onClick(displayChart);
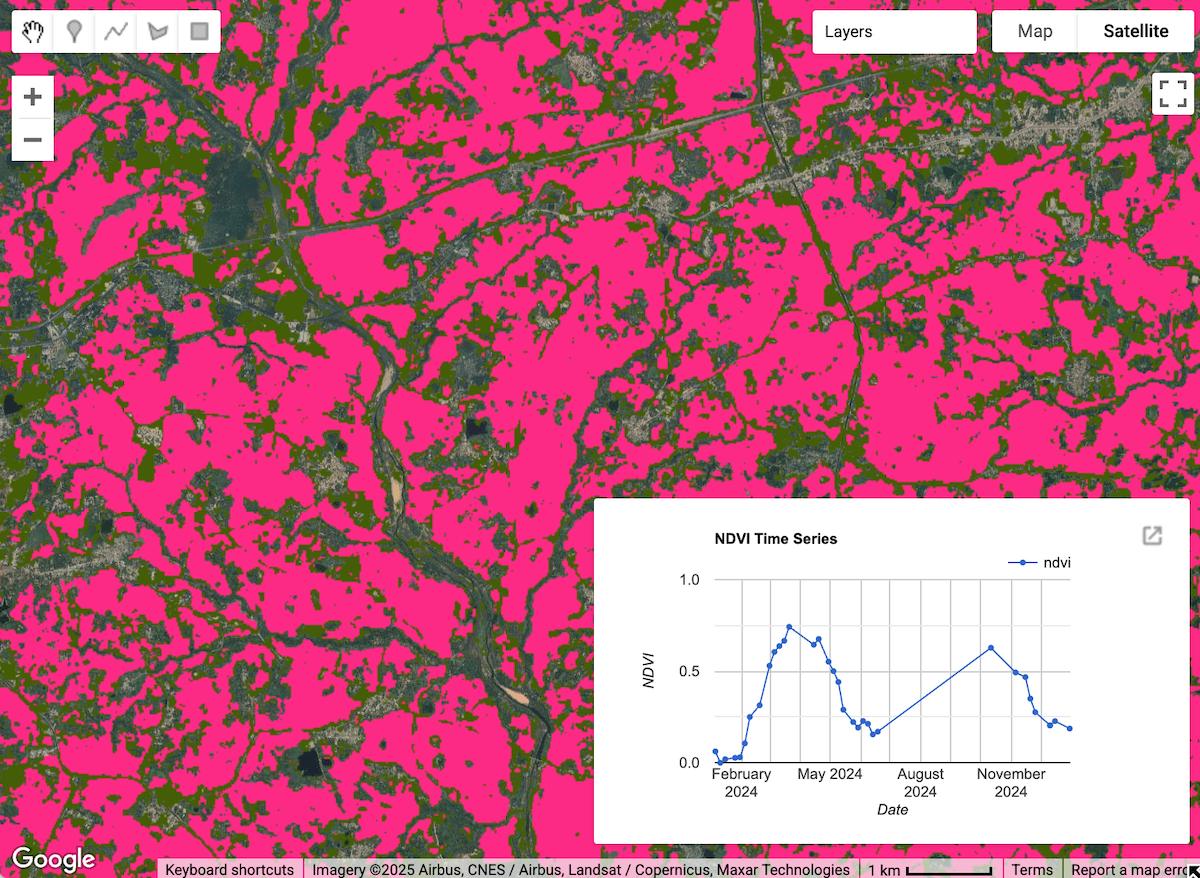
// Exercise
// Delete the geometry
// Draw a geometry for your region of interest
// Adjust the minClusters and maxClusters based on your knowledge
// Click on any location to see the NDVI Time-Series
// Use your local knowledge to identify the crop(s)
// Note: Interactive visualization of clusters will only work for
// small regions. Export your training samples as Asset first
// if classifying large regions.
// The region selected here is in the Bargarh distrct, Odisha, India
// with the primary crop being Rice.
// Data from https://upag.gov.in/03. Mapping Mangroves
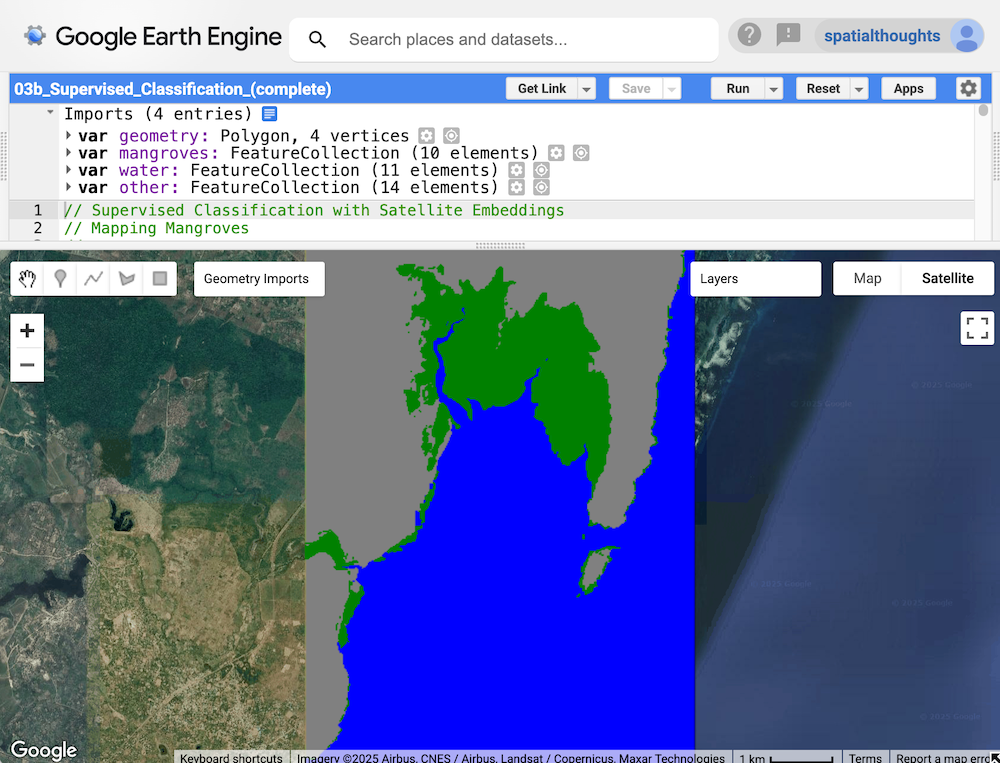
Mangrove Classification with Satellite Embedding Dataset
// Supervised Classification with Satellite Embeddings
// Mapping Mangroves
// ****************************************************

// Select a region
// ****************************************************

// Draw a polygon to define the region
// Save it as the variable 'geometry'
Map.centerObject(geometry);

// Collect Training Samples
// ****************************************************

// Pick a year for classification
var year = 2020;
var startDate = ee.Date.fromYMD(year, 1, 1);
var endDate = startDate.advance(1, 'year');

// Create a Sentinel-2 Compsite for the selected year
// for selecting training samples
var s2 = ee.ImageCollection('COPERNICUS/S2_SR_HARMONIZED');
var filteredS2 = s2
  .filter(ee.Filter.date(startDate, endDate))
  .filter(ee.Filter.bounds(geometry));

// Use the Cloud Score+ collection for cloud masking
var csPlus = ee.ImageCollection('GOOGLE/CLOUD_SCORE_PLUS/V1/S2_HARMONIZED');
var csPlusBands = csPlus.first().bandNames();
var filteredS2WithCs = filteredS2.linkCollection(csPlus, csPlusBands);

function maskLowQA(image) {
  var qaBand = 'cs';
  var clearThreshold = 0.6;
  var mask = image.select(qaBand).gte(clearThreshold);
  return image.updateMask(mask);
}

var filteredS2Masked = filteredS2WithCs
  .map(maskLowQA)
  .select('B.*');

// Create a median composite of cloud-masked images
var composite = filteredS2Masked.median();

// Display the input composite in false color
// that helps distinguish between
// water, vegetation and built surfaces
var swirVis = {min: 300, max: 4000, bands: ['B11', 'B8', 'B4']};

Map.centerObject(geometry);
Map.addLayer(composite.clip(geometry), swirVis, 'S2 Composite (False Color)');

// Merge the collected training samples
var gcps = mangroves.merge(water).merge(other);

// Train a Classifier
// ****************************************************

// Sample Embedding Vectors
var embeddings = ee.ImageCollection('GOOGLE/SATELLITE_EMBEDDING/V1/ANNUAL');

var embeddingsFiltered = embeddings
  .filter(ee.Filter.date(startDate, endDate))
  .filter(ee.Filter.bounds(geometry));

var embeddingsImage = embeddingsFiltered.mosaic();

// Overlay the samples on the image to get training data.
var training = embeddingsImage.sampleRegions({
  collection: gcps,
  properties: ['landcover'],
  scale: 10
});


// Train a classifier.
var classifier = ee.Classifier.smileKNN().train({
  features: training,
  classProperty: 'landcover',
  inputProperties: embeddingsImage.bandNames()
});

// Classify the Satellite Embedding Mosaic
// ****************************************************

var classified = embeddingsImage.classify(classifier);


// ~~~~~~~~~~~~~~~~~~~~~~~~~~~~~~~~~~~~~~~~~~~~~~~~~~~~
// Export classified image to an asset (optional)
// ~~~~~~~~~~~~~~~~~~~~~~~~~~~~~~~~~~~~~~~~~~~~~~~~~~~~

// Replace this with your asset folder
// The folder must exist before exporting
var exportFolder = 'projects/spatialthoughts/assets/satellite_embedding/';

var classifiedExportImage = 'mangrove_classification';
var classifiedExportImagePath = exportFolder + classifiedExportImage;

Export.image.toAsset({
  image: classified.clip(geometry),
  description: 'Classified_Image_Export',
  assetId: classifiedExportImagePath,
  region: geometry,
  scale: 10,
  pyramidingPolicy: 'MODE',
  maxPixels: 1e10
});

// Wait for the export to complete and continue with
// the exported asset from here onwards.

// Use the exported asset
var classified = ee.Image(classifiedExportImagePath);

// ~~~~~~~~~~~~~~~~~~~~~~~~~~~~~~~~~~~~~~~~~~~~~~~~~~~~
// End optional export section
// ~~~~~~~~~~~~~~~~~~~~~~~~~~~~~~~~~~~~~~~~~~~~~~~~~~~~

// Visualize the classification
// ****************************************************

// Choose a 3-color palette
// Assign a color for each class in the following order
// Mangrove, Water, Other
var palette = ['green', 'blue', 'gray'];

Map.addLayer(
  classified.clip(geometry),
  {min: 1, max: 3, palette: palette},
  'Classified Satellite Embeddings Image');

// Extract mangroves class
var mangrovesImage = classified.eq(1).selfMask();

var mangroveVis = {min:0, max:1, palette: ['green']};

Map.addLayer(mangrovesImage.clip(geometry),
  mangroveVis, 'Mangroves (Satellite Embedding Classification)');
Exercise
// Exercise: Mapping Mangroves
// ****************************************************

// Select the region
// ****************************************************
var geometry = ee.Geometry.Polygon([[
  [39.4926, -4.39833],
  [39.4926, -4.47394],
  [39.5491, -4.47394],
  [39.5491, -4.39833]
]]);

Map.centerObject(geometry);

// Pick a year for classification
var year = 2020;
var startDate = ee.Date.fromYMD(year, 1, 1);
var endDate = startDate.advance(1, 'year');

// Create a Sentinel-2 Compsite for the selected year
// for selecting training samples
var s2 = ee.ImageCollection('COPERNICUS/S2_SR_HARMONIZED');
var filteredS2 = s2
  .filter(ee.Filter.date(startDate, endDate))
  .filter(ee.Filter.bounds(geometry));

// Use the Cloud Score+ collection for cloud masking
var csPlus = ee.ImageCollection('GOOGLE/CLOUD_SCORE_PLUS/V1/S2_HARMONIZED');
var csPlusBands = csPlus.first().bandNames();
var filteredS2WithCs = filteredS2.linkCollection(csPlus, csPlusBands);

function maskLowQA(image) {
  var qaBand = 'cs';
  var clearThreshold = 0.6;
  var mask = image.select(qaBand).gte(clearThreshold);
  return image.updateMask(mask);
}

var filteredS2Masked = filteredS2WithCs
  .map(maskLowQA)
  .select('B.*');

// Create a median composite of cloud-masked images
var composite = filteredS2Masked.median();

// Display the input composite in false color
// that helps distinguish between
// water, vegetation and built surfaces
var swirVis = {min: 300, max: 4000, bands: ['B11', 'B8', 'B4']};

Map.centerObject(geometry);
Map.addLayer(composite.clip(geometry), swirVis, 'S2 Composite (False Color)');

//  Global Mangrove Watch reference layer
var gmw = ee.ImageCollection('projects/earthengine-legacy/assets/projects/sat-io/open-datasets/GMW/extent/GMW_V3');
var gmwFiltered = gmw
  .filter(ee.Filter.date(startDate, endDate));
var gmwImage = gmwFiltered.mosaic();

Map.addLayer(gmwImage,
  {min:0, max:1, palette: ['purple']},
  'Reference Mangrove Layer', false);

// Exercise
// Delete the geometry and draw a polygon for your region of interest
//   Tip: Turn on Reference Mangrove Layer to previously mapped
//        locations of mangroves.
// Add training samples for 3 classes
// Create FeatureCollections and the
// 'landcover' property as follows

// mangroves: 1
// water: 2
// other: 3

// After adding samples, uncomments lines below
// Use Ctrl + / keyboard shortcut for uncommenting selection

// // ****************************************************

// // Merge the collected training samples
// var gcps = mangroves.merge(water).merge(other);

// // Train a Classifier
// // ****************************************************

// // Sample Embedding Vectors
// var embeddings = ee.ImageCollection('GOOGLE/SATELLITE_EMBEDDING/V1/ANNUAL');

// var embeddingsFiltered = embeddings
//   .filter(ee.Filter.date(startDate, endDate))
//   .filter(ee.Filter.bounds(geometry));

// var embeddingsImage = embeddingsFiltered.mosaic();

// // Overlay the samples on the image to get training data.
// var training = embeddingsImage.sampleRegions({
//   collection: gcps,
//   properties: ['landcover'],
//   scale: 10
// });


// // Train a classifier.
// var classifier = ee.Classifier.smileKNN().train({
//   features: training,
//   classProperty: 'landcover',
//   inputProperties: embeddingsImage.bandNames()
// });

// // Classify the Satellite Embedding Mosaic
// // ****************************************************

// var classified = embeddingsImage.classify(classifier);

// // Visualize the classification
// // ****************************************************

// // Choose a 3-color palette
// // Assign a color for each class in the following order
// // Mangrove, Water, Other
// var palette = ['green', 'blue', 'gray'];

// Map.addLayer(
//   classified.clip(geometry),
//   {min: 1, max: 3, palette: palette},
//   'Classified Satellite Embeddings Image');

// // Extract mangroves class
// var mangrovesImage = classified.eq(1).selfMask();

// var mangroveVis = {min:0, max:1, palette: ['green']};

// Map.addLayer(mangrovesImage.clip(geometry),
//   mangroveVis, 'Mangroves (Satellite Embedding Classification)');
04. Object Detection with Similarity Search
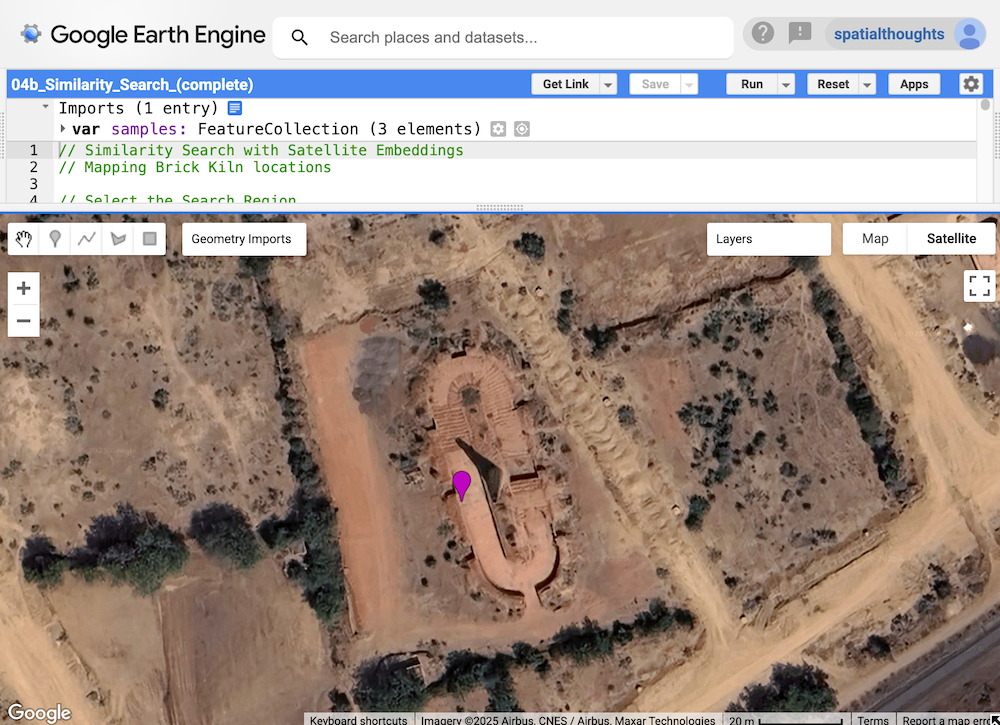
Detecting Brick Kilns with Similarity Search
// Similarity Search with Satellite Embeddings
// Mapping Brick Kiln locations

// Select the Search Region
// ****************************************************

// Use GAUL 2024 dataset from GEE Community Catalog
var admin2 = ee.FeatureCollection('projects/sat-io/open-datasets/FAO/GAUL/GAUL_2024_L2');
// Gandhinagar district, Gujarat, India
var filteredAdmin2 = admin2
  .filter(ee.Filter.eq('gaul2_name', 'Gandhinagar'))
  .filter(ee.Filter.eq('gaul1_name', 'Gujarat'));

var geometry = filteredAdmin2.geometry();

Map.centerObject(geometry);
Map.addLayer(geometry, {color: 'red'}, 'Search Area');

// Select Reference Location(s)
// ****************************************************

// Use the satellite basemap
Map.setOptions('SATELLITE');

// Add a few reference locations of Brick Kilns
// in the 'samples' FeatureCollection


// Select a time-period
// ****************************************************
var year = 2024;
var startDate = ee.Date.fromYMD(year, 1, 1);
var endDate = startDate.advance(1, 'year');

// Filter and mosaic the Satellite Embedding dataset
// ****************************************************
var embeddings = ee.ImageCollection('GOOGLE/SATELLITE_EMBEDDING/V1/ANNUAL');
var mosaic = embeddings
  .filter(ee.Filter.date(startDate, endDate))
  .mosaic();

// Choose the scale
// You may choose a larger value for larger objects
var scale = 20;

// Extract the embedding vector from the samples
var sampleEmbeddings = mosaic.sampleRegions({
  collection: samples,
  scale: scale
});

// Calculate Similarity
// ****************************************************
// We compute the dot product between two embedding vectors
// Results are interepreted as distances in embedding space
// Values closer to 1 are closer together (more similar)
// Values closer to -1 are further apart (less similar)
var bandNames = mosaic.bandNames();

var sampleDistances = ee.ImageCollection(sampleEmbeddings.map(function (f) {
  var arrayImage = ee.Image(f.toArray(bandNames)).arrayFlatten([bandNames]);
  var dotProduct = arrayImage.multiply(mosaic)
    .reduce('sum')
    .rename('similarity');
  return dotProduct;
}));

// Calculate mean distance from all reference locations
var meanDistance = sampleDistances.mean();

// Visualize the distance image
var palette = [
  '000004', '2C105C', '711F81', 'B63679',
  'EE605E', 'FDAE78', 'FCFDBF', 'FFFFFF'
];
var similarityVis = {palette: palette, min: 0.5, max: 1};
Map.addLayer(meanDistance.clip(geometry), similarityVis,
  'Similarity (bright = close)', false);


// Extract Location Matches
// ****************************************************

// Apply a threshold
var threshold = 0.97;
var similarPixels = meanDistance.gt(threshold);

// Vectorize the results
// Mask 0 values using selfMask()
// to get polygons only for the matched pixels
var polygons = similarPixels.selfMask().reduceToVectors({
  scale: scale,
  eightConnected: false,
  maxPixels: 1e10,
  geometry: geometry
});

// Extract the centroids of vectorized polygons
var predictedMatches = polygons.map(function(f) {
  return f.centroid({maxError:1});
});

// ~~~~~~~~~~~~~~~~~~~~~~~~~~~~~~~~~~~~~~~~~~~~~~~~~~~~
// Export matches to an asset (optional)
// ~~~~~~~~~~~~~~~~~~~~~~~~~~~~~~~~~~~~~~~~~~~~~~~~~~~~

// Vectorization operation is a memory and compute-intensive
// operation. To prevent errors, Export the results as an Asset first.

// Once the asset is exported, it can be imported and visualized

// Replace this with your asset folder
// The folder must exist before exporting
var exportFolder = 'projects/spatialthoughts/assets/satellite_embedding/';
var matchesExportFc = 'predicted_brick_kiln_matches';
var matchesExportFcPath = exportFolder + matchesExportFc;

Export.table.toAsset({
  collection: predictedMatches,
  description: 'Predicted_Matches_Export',
  assetId: matchesExportFcPath
});

// Wait for the export to complete and continue with
// the exported asset from here onwards.
//var predictedMatches = ee.FeatureCollection(matchesExportFcPath);

// ~~~~~~~~~~~~~~~~~~~~~~~~~~~~~~~~~~~~~~~~~~~~~~~~~~~~
// End optional export section
// ~~~~~~~~~~~~~~~~~~~~~~~~~~~~~~~~~~~~~~~~~~~~~~~~~~~~

// Visualize the Matches
// ****************************************************

Map.addLayer(predictedMatches, {color: 'cyan'} , 'Predicted Matches');
Exercise
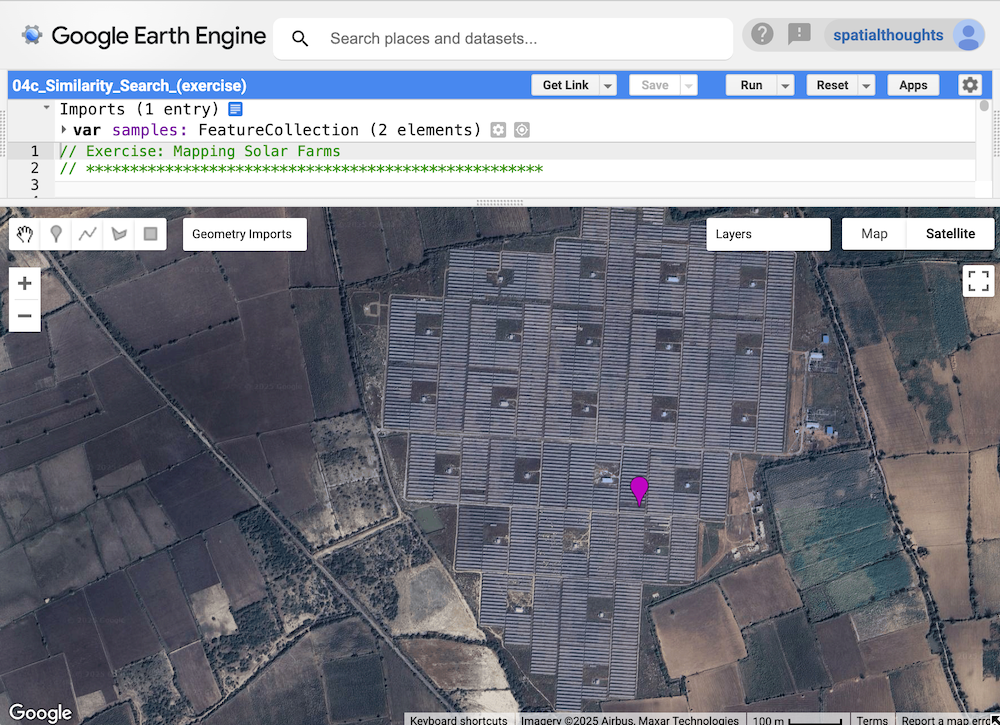
Exercise to Map Solar Farms with Similarity Search
// Exercise: Mapping Solar Farms
// ****************************************************

// Select the Search Region
// ****************************************************
var geometry = ee.Geometry.Polygon([[
  [71.2208, 23.6897],
  [71.2208, 23.1642],
  [71.8614, 23.1642],
  [71.8614, 23.6897]
]]);
Map.centerObject(geometry);
Map.addLayer(geometry, {color: 'red'}, 'Search Area');

// Select Reference Location(s)
// ****************************************************

// Use the satellite basemap
Map.setOptions('SATELLITE');

// Mark location(s) with solar farms in the 'samples' FeatureCollection

// Select a time-period
// ****************************************************
var year = 2024;
var startDate = ee.Date.fromYMD(year, 1, 1);
var endDate = startDate.advance(1, 'year');

// Filter and mosaic the Satellite Embedding dataset
// ****************************************************
var embeddings = ee.ImageCollection('GOOGLE/SATELLITE_EMBEDDING/V1/ANNUAL');
var mosaic = embeddings
  .filter(ee.Filter.date(startDate, endDate))
  .mosaic();

// Choose the scale
// You may choose a larger value for larger objects
var scale = 10;

// Extract the embedding vector from the samples
var sampleEmbeddings = mosaic.sampleRegions({
  collection: samples,
  scale: scale
});

// Calculate Similarity
// ****************************************************
// We compute the dot product between two embedding vectors
// Results are interepreted as distances in embedding space
// Values closer to 1 are closer together (more similar)
// Values closer to -1 are further apart (less similar)
var bandNames = mosaic.bandNames();

var sampleDistances = ee.ImageCollection(sampleEmbeddings.map(function (f) {
  var arrayImage = ee.Image(f.toArray(bandNames)).arrayFlatten([bandNames]);
  var dotProduct = arrayImage.multiply(mosaic)
    .reduce('sum')
    .rename('similarity');
  return dotProduct;
}));

// Calculate mean distance from all reference locations
var meanDistance = sampleDistances.mean();

// Visualize the distance image
var palette = [
  '000004', '2C105C', '711F81', 'B63679',
  'EE605E', 'FDAE78', 'FCFDBF', 'FFFFFF'
];
var similarityVis = {palette: palette, min: 0.5, max: 1};
Map.addLayer(meanDistance.clip(geometry), similarityVis,
  'Similarity (bright = close)', false);


// Extract Location Matches
// ****************************************************

// Apply a threshold
var threshold = 0.95;
var similarPixels = meanDistance.gt(threshold);

// Vectorize the results
// Mask 0 values using selfMask()
// to get polygons only for the matched pixels
var polygons = similarPixels.selfMask().reduceToVectors({
  scale: scale,
  eightConnected: false,
  maxPixels: 1e10,
  geometry: geometry
});

// Extract the centroids of vectorized polygons
var predictedMatches = polygons.map(function(f) {
  return f.centroid({maxError:1});
});

// Visualize the Matches
// ****************************************************

Map.addLayer(predictedMatches, {color: 'cyan'} , 'Predicted Matches');


// Use the Global Photovoltaics Inventory dataset
// https://gee-community-catalog.org/projects/global_pv/
var solarFarms = ee.FeatureCollection('projects/sat-io/open-datasets/global_photovoltaic/predicted_set');
Map.addLayer(solarFarms, {color:'yellow'}, 'Solar Farms Database', false);

// Exercise
// Delete the geometry
// Draw a geometry for your region of interest
//    Tip: Use a rural region without rooftop solar
// Adjust the scale and threshold
// Visualize the results


// Note: Interactive visualization of results will only work for
//      small regions. Export the predicted matches as Asset first
//      if working in a large regions.
Supplement
Similarity Search with Area Filtering
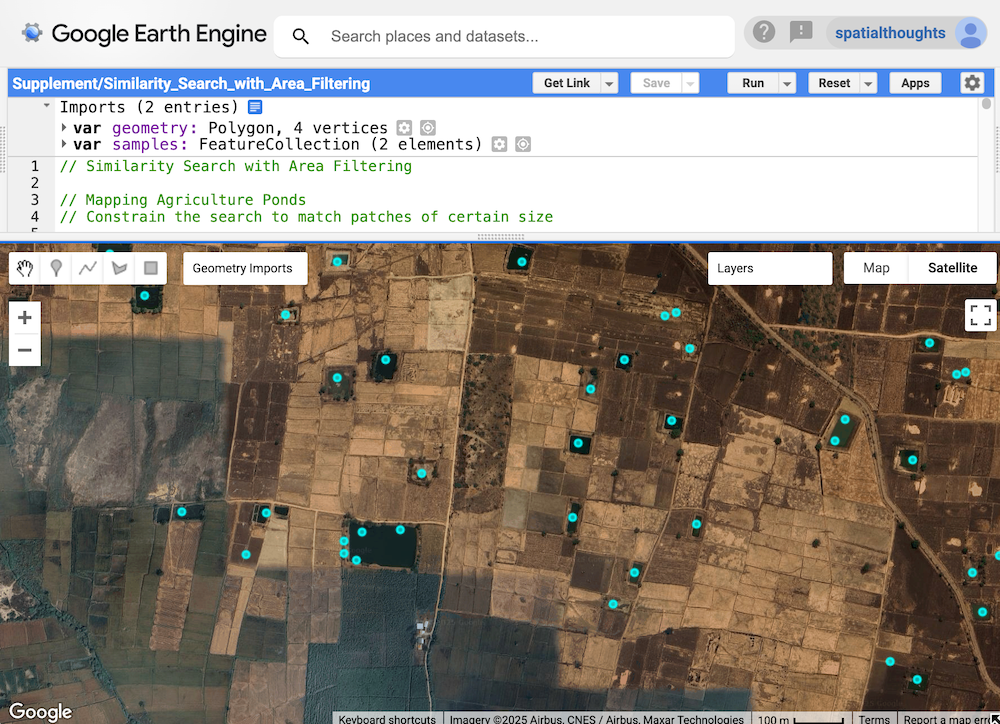
Similarity Search to Detect Farm Ponds
// Similarity Search with Area Filtering

// Mapping Agriculture Ponds
// Constrain the search to match patches of certain size

Map.addLayer(geometry, {color: 'red'}, 'Search Area');
Map.centerObject(samples, 15);

// Select Reference Location(s)
// ****************************************************

// Use the satellite basemap
Map.setOptions('SATELLITE');

// Add a few reference locations of Brick Kilns
// in the 'samples' FeatureCollection


// Select a time-period
// ****************************************************
var year = 2024;
var startDate = ee.Date.fromYMD(year, 1, 1);
var endDate = startDate.advance(1, 'year');

// Filter and mosaic the Satellite Embedding dataset
// ****************************************************
var embeddings = ee.ImageCollection('GOOGLE/SATELLITE_EMBEDDING/V1/ANNUAL');
var mosaic = embeddings
  .filter(ee.Filter.date(startDate, endDate))
  .mosaic();

// Choose the scale
// You may choose a larger value for larger objects
var scale = 10;

// Extract the embedding vector from the samples
var sampleEmbeddings = mosaic.sampleRegions({
  collection: samples,
  scale: scale
});

// Calculate Similarity
// ****************************************************
// We compute the dot product between two embedding vectors
// Results are interepreted as distances in embedding space
// Values closer to 1 are closer together (more similar)
// Values closer to -1 are further apart (less similar)
var bandNames = mosaic.bandNames();

var sampleDistances = ee.ImageCollection(sampleEmbeddings.map(function (f) {
  var arrayImage = ee.Image(f.toArray(bandNames)).arrayFlatten([bandNames]);
  var dotProduct = arrayImage.multiply(mosaic)
    .reduce('sum')
    .rename('similarity');
  return dotProduct;
}));

// Calculate mean distance from all reference locations
var meanDistance = sampleDistances.mean();

// Visualize the distance image
var palette = [
  '000004', '2C105C', '711F81', 'B63679',
  'EE605E', 'FDAE78', 'FCFDBF', 'FFFFFF'
];
var similarityVis = {palette: palette, min: 0.5, max: 1};
Map.addLayer(meanDistance.clip(geometry), similarityVis,
  'Similarity (bright = close)', false);


// Extract Location Matches
// ****************************************************

// Apply a threshold
var threshold = 0.90;
var similarPixels = meanDistance.gt(threshold);

Map.addLayer(similarPixels.selfMask().clip(geometry),
  {min:0, max:1, palette: ['white', 'blue']},
  'Detected Patches', false);

// Area in Sq. Meters
var minArea = 1000;
var maxArea = 10000;

// Calculate size of pixel at chosen scale
var pixelArea = ee.Number(scale).pow(2);

var minPixels = ee.Number(minArea).divide(pixelArea).round();
var maxPixels = ee.Number(maxArea).divide(pixelArea).round();
print('Minimum Pixels', minPixels);
print('Maximum Pixels', maxPixels);
var connections = similarPixels.selfMask().connectedPixelCount(maxPixels);

var similarPixelsFiltered = similarPixels.selfMask()
  .updateMask(connections.gte(minPixels))
  .updateMask(connections.lte(maxPixels));

// Vectorize the results
// Mask 0 values using selfMask()
// to get polygons only for the matched pixels
var polygons = similarPixels.selfMask().reduceToVectors({
  scale: scale,
  eightConnected: false,
  maxPixels: 1e10,
  geometry: geometry
});

// Extract the centroids of vectorized polygons
var predictedMatches = polygons.map(function(f) {
  return f.centroid({maxError:1});
});

// ~~~~~~~~~~~~~~~~~~~~~~~~~~~~~~~~~~~~~~~~~~~~~~~~~~~~
// Export matches to an asset (optional)
// ~~~~~~~~~~~~~~~~~~~~~~~~~~~~~~~~~~~~~~~~~~~~~~~~~~~~

// Vectorization operation is a memory and compute-intensive
// operation. To prevent errors, Export the results as an Asset first.

// Once the asset is exported, it can be imported and visualized

// Replace this with your asset folder
// The folder must exist before exporting
var exportFolder = 'projects/spatialthoughts/assets/satellite_embedding/';
var matchesExportFc = 'predicted_farm_ponds_matches';
var matchesExportFcPath = exportFolder + matchesExportFc;

Export.table.toAsset({
  collection: predictedMatches,
  description: 'Predicted_Matches_Export',
  assetId: matchesExportFcPath
});

// Wait for the export to complete and continue with
// the exported asset from here onwards.
//var predictedMatches = ee.FeatureCollection(matchesExportFcPath);

// ~~~~~~~~~~~~~~~~~~~~~~~~~~~~~~~~~~~~~~~~~~~~~~~~~~~~
// End optional export section
// ~~~~~~~~~~~~~~~~~~~~~~~~~~~~~~~~~~~~~~~~~~~~~~~~~~~~

// Visualize the Matches
// ****************************************************

Map.addLayer(predictedMatches, {color: 'cyan'} , 'Predicted Matches');
Similarity Search with Negative Examples
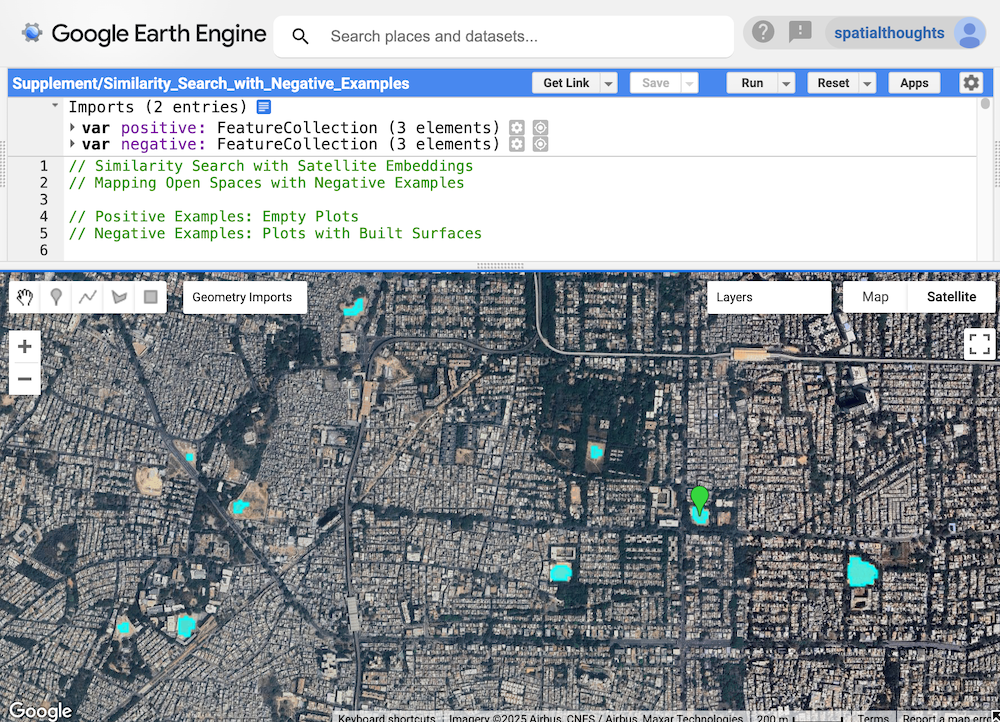
Similarity Search to Map Open Plots
// Similarity Search with Satellite Embeddings
// Mapping Open Spaces with Negative Examples

// Positive Examples: Empty Plots
// Negative Examples: Plots with Built Surfaces

// If you want to give many other types of negative examples
// it is better to go for a supervised classification
// approach where you can give many different types
// of negative examples in a binary classification

// Select the Search Region
// ****************************************************

// Use GAUL 2024 dataset from GEE Community Catalog
var admin2 = ee.FeatureCollection('projects/sat-io/open-datasets/FAO/GAUL/GAUL_2024_L2');

// Select Bengalore, India region
var filteredAdmin2 = admin2
  .filter(ee.Filter.eq('gaul2_name', 'Bengaluru Urban'))
  .filter(ee.Filter.eq('gaul1_name', 'Karnataka'));

var geometry = filteredAdmin2.geometry();

Map.centerObject(geometry);
Map.addLayer(geometry, {color: 'red'}, 'Search Area');

// Select Reference Location(s)
// ****************************************************

// Use the satellite basemap
Map.setOptions('SATELLITE');

// Add a few reference locations of Brick Kilns
// in the 'samples' FeatureCollection


// Select a time-period
// ****************************************************
var year = 2024;
var startDate = ee.Date.fromYMD(year, 1, 1);
var endDate = startDate.advance(1, 'year');

// Filter and mosaic the Satellite Embedding dataset
// ****************************************************
var embeddings = ee.ImageCollection('GOOGLE/SATELLITE_EMBEDDING/V1/ANNUAL');
var mosaic = embeddings
  .filter(ee.Filter.date(startDate, endDate))
  .mosaic();

// Choose the scale
// You may choose a larger value for larger objects
var scale = 10;

// Extract the embedding vector from the samples
var positiveEmbeddings = mosaic.sampleRegions({
  collection: positive,
  scale: scale
});

var negativeEmbeddings = mosaic.sampleRegions({
  collection: negative,
  scale: scale
});

// Calculate Similarity
// ****************************************************
// We compute the dot product between two embedding vectors
// Results are interepreted as distances in embedding space
// Values closer to 1 are closer together (more similar)
// Values closer to -1 are further apart (less similar)
var bandNames = mosaic.bandNames();

var positiveDistances = ee.ImageCollection(positiveEmbeddings.map(function (f) {
  var arrayImage = ee.Image(f.toArray(bandNames)).arrayFlatten([bandNames]);
  var dotProduct = arrayImage.multiply(mosaic)
    .reduce('sum')
    .rename('similarity');
  return dotProduct;
}));

// Calculate mean distance from all reference locations
var meanPositive = positiveDistances.mean();


var negativeDistances = ee.ImageCollection(negativeEmbeddings.map(function (f) {
  var arrayImage = ee.Image(f.toArray(bandNames)).arrayFlatten([bandNames]);
  var dotProduct = arrayImage.multiply(mosaic)
    .reduce('sum')
    .rename('similarity');
  return dotProduct;
}));

// Calculate mean distance from all reference locations
var meanNegative = negativeDistances.mean();

// Visualize the distance image
var palette = [
  '000004', '2C105C', '711F81', 'B63679',
  'EE605E', 'FDAE78', 'FCFDBF', 'FFFFFF'
];
var similarityVis = {palette: palette, min: 0.5, max: 1};
Map.addLayer(meanPositive.clip(geometry), similarityVis,
  'Positive Similarity', false);
Map.addLayer(meanNegative.clip(geometry), similarityVis,
  'Negative Similarity', false);


// Extract Location Matches
// ****************************************************

// Apply a threshold
// Increasing will add fewer positive matches
// Decreasing will add more positive matches
var positivethreshold = 0.85;
var similarPositivePixels = meanPositive.gt(positivethreshold);

// Increasing will remove fewer positive matches
// Decreasing will remove more positive matches
var negativethreshold = 0.85;
var similarNegativePixels = meanNegative.gt(negativethreshold);

// Within the positive matches, find pixels 'dissimilar'
// to negative example
var similarity = similarPositivePixels
  .updateMask(similarNegativePixels.not()).selfMask();

Map.addLayer(similarity.clip(geometry), similarityVis,
  'Result (Similar to Positive, Dissimilar to Negative)', false);

// Vectorize the results
// Mask 0 values using selfMask()
// to get polygons only for the matched pixels
var predictedMatches = similarity.selfMask().reduceToVectors({
  scale: scale,
  eightConnected: false,
  maxPixels: 1e10,
  geometry: geometry
});

// Extract the centroids of vectorized polygons
// var predictedMatches = polygons.map(function(f) {
//   return f.centroid({maxError:1});
// });

// ~~~~~~~~~~~~~~~~~~~~~~~~~~~~~~~~~~~~~~~~~~~~~~~~~~~~
// Export matches to an asset (optional)
// ~~~~~~~~~~~~~~~~~~~~~~~~~~~~~~~~~~~~~~~~~~~~~~~~~~~~

// Vectorization operation is a memory and compute-intensive
// operation. To prevent errors, Export the results as an Asset first.

// Once the asset is exported, it can be imported and visualized

// Replace this with your asset folder
// The folder must exist before exporting
var exportFolder = 'projects/spatialthoughts/assets/satellite_embedding/';
var matchesExportFc = 'predicted_open_spaces_matches';
var matchesExportFcPath = exportFolder + matchesExportFc;

Export.table.toAsset({
  collection: predictedMatches,
  description: 'Predicted_Matches_Export',
  assetId: matchesExportFcPath
});

// Wait for the export to complete and continue with
// the exported asset from here onwards.
//var predictedMatches = ee.FeatureCollection(matchesExportFcPath);

// ~~~~~~~~~~~~~~~~~~~~~~~~~~~~~~~~~~~~~~~~~~~~~~~~~~~~
// End optional export section
// ~~~~~~~~~~~~~~~~~~~~~~~~~~~~~~~~~~~~~~~~~~~~~~~~~~~~

// Visualize the Matches
// ****************************************************

Map.addLayer(predictedMatches, {color: 'cyan'} , 'Predicted Matches');
Mapping Surface Water with Unsupervised Classification
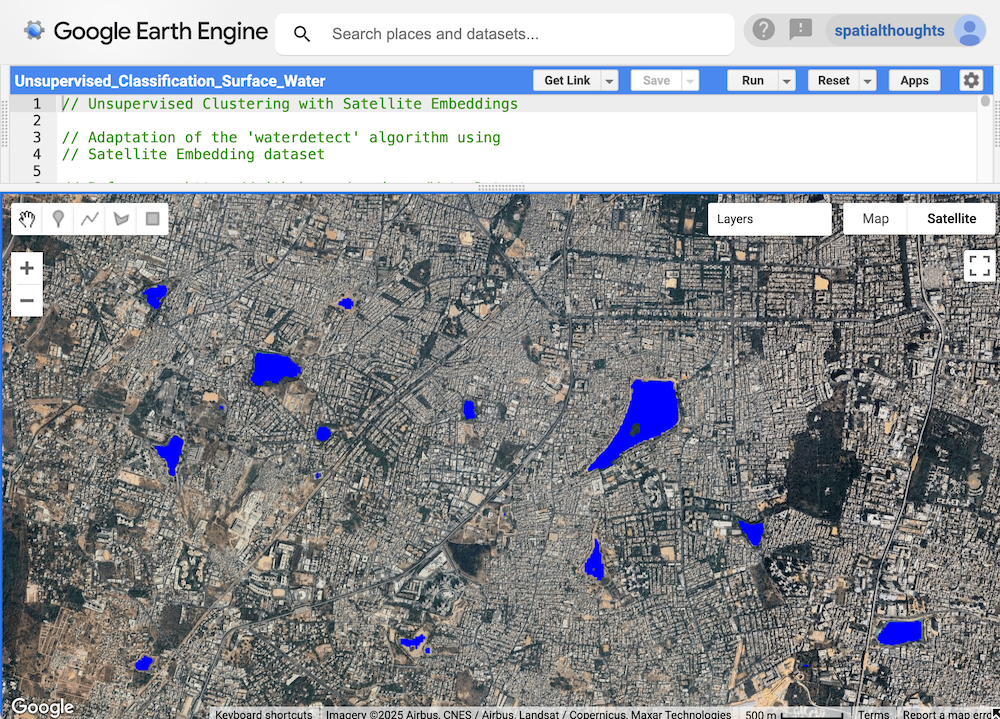
Mapping Surface Water with Unsupervised Clustering
// Unsupervised Clustering with Satellite Embeddings

// Adaptation of the 'waterdetect' algorithm using
// Satellite Embedding dataset

// Reference: https://github.com/cordmaur/WaterDetect
// Cordeiro, M. C. R.; Martinez, J.-M.; Peña-Luque, S.
// Automatic Water Detection from Multidimensional Hierarchical Clustering for Sentinel-2 Images
// and a Comparison with Level 2A Processors.
// Remote Sensing of Environment 2021, 253, 112209. https://doi.org/10.1016/j.rse.2020.112209.

// Use the satellite basemap
Map.setOptions('SATELLITE');

// Draw a polygon to define the region
var geometry = ee.Geometry.Polygon([[
  [77.48932, 13.0311],
  [77.48932, 12.8130],
  [77.72828, 12.8130],
  [77.72828, 13.0311]
]]);


Map.centerObject(geometry, 12);


// Prepare the Satellite Embedding dataset
// ****************************************************
var embeddings = ee.ImageCollection('GOOGLE/SATELLITE_EMBEDDING/V1/ANNUAL');

var year = 2024;
var startDate = ee.Date.fromYMD(year, 1, 1);
var endDate = startDate.advance(1, 'year');

var filteredEmbeddings = embeddings
  .filter(ee.Filter.date(startDate, endDate))
  .filter(ee.Filter.bounds(geometry));

var embeddingsImage = filteredEmbeddings.mosaic();

print('Satellite Embeddings Image', embeddingsImage);

// Perform Unsupervised Clustering
// ****************************************************

// Make the training dataset for unsupervised clustering
var training = embeddingsImage.sample({
  region: geometry,
  scale: 10,
  numPixels: 1000
});
print(training.first());

// Instantiate the clusterer and train it.
var clusterer = ee.Clusterer.wekaCascadeKMeans({
  minClusters: 10,
  maxClusters: 12
}).train(training);

// Cluster the stacked image
var clustered = embeddingsImage.cluster(clusterer);

// Automatic Detection of Water Cluster
// ****************************************************

// We need to identify which of the clusters represent water
// Use Sentinel-2 MNDWI to find the 'water' cluster automaticallly
// Prepare a Sentinel-2 composite for the selected region
var s2 = ee.ImageCollection("COPERNICUS/S2_SR_HARMONIZED");

var filtered = s2.filter(ee.Filter.lt('CLOUDY_PIXEL_PERCENTAGE', 30))
  .filter(ee.Filter.date(startDate, endDate))
  .filter(ee.Filter.bounds(geometry));

// Load the Cloud Score+ collection
var csPlus = ee.ImageCollection('GOOGLE/CLOUD_SCORE_PLUS/V1/S2_HARMONIZED');
var csPlusBands = csPlus.first().bandNames();

// We need to add Cloud Score + bands to each Sentinel-2
// image in the collection
// This is done using the linkCollection() function
var filteredS2WithCs = filtered.linkCollection(csPlus, csPlusBands);

// Function to mask pixels with low CS+ QA scores.
function maskLowQA(image) {
  var qaBand = 'cs';
  var clearThreshold = 0.5;
  var mask = image.select(qaBand).gte(clearThreshold);
  return image.updateMask(mask);
}

var filteredMasked = filteredS2WithCs
  .map(maskLowQA)
  .select('B.*');

var image = filteredMasked.median();

// Calculate Modified Normalized Difference Water Index (MNDWI)
// 'GREEN' (B3) and 'SWIR1' (B11)
var mndwi = image.normalizedDifference(['B3', 'B11']).rename(['mndwi']);

// We use the MNDWI band and select the cluster with the
// highest average MNDWI values of all pixels within the cluster

// Calculate the stats on MNDWI band, grouped by clusters
// Copmpute at lower resolution as accuracy is not
// important. We just need to find the cluster with
// highest MNDWI
var stats = mndwi.addBands(clustered).reduceRegion({
  reducer: ee.Reducer.mean().group({
    groupField: 1,
    groupName: 'cluster',
  }),
  geometry: geometry,
  scale: 100,
  maxPixels: 1e8
});
print(stats);

// Extract the cluster-wise stats as a list of lists
// We get a list in the following format
// [[avg_mndwi, cluster_number], [avg_mndwi, cluster_number] ...]]
var groupStats = ee.List(stats.get('groups'));

var groupStatsLists = groupStats.map(function(item) {
      var areaDict = ee.Dictionary(item);
      var clusterNumber = ee.Number(
        areaDict.get('cluster'));
      var mndwi = ee.Number(
        areaDict.get('mean'));
      return ee.List([mndwi, clusterNumber]);
    });

// Use the ee.Reducer.max() on the list of lists
// It will pick the list with the highest MNDWI
var waterClusterList = ee.Dictionary(ee.List(groupStatsLists)
  .reduce(ee.Reducer.max(2)));

// Extract the cluster number
var waterCluster = ee.Number(waterClusterList.get('max1'));

// Select all pixels from the water cluster and mask everything else
var water = clustered.eq(waterCluster).selfMask();

// The original waterdetect algorithm has an additional step
// to train a supervised classifier using the water vs. non-water
// samples detected from the procedure above.
// In our testing, there was no significant improvement to the
// output, so we have not added that step.

// Visualize the results
// ****************************************************
var waterVis = {min:0, max:1, palette: ['white', 'blue']};

Map.setCenter(77.61, 13.08, 14);

Map.centerObject(geometry, 10);
Map.addLayer(clustered.clip(geometry).randomVisualizer(), {}, 'clusters');
Map.addLayer(water.clip(geometry), waterVis, 'water');

// Interactive visualization may time-out for large images
// Export the image to use the batch processing mode
Export.image.toDrive({
  image: water,
  description: 'Water_Cluster',
  folder: 'earthengine',
  fileNamePrefix: 'water_cluster',
  region: geometry,
  scale: 10,
  maxPixels: 1e10});
Mapping Urban Tree Cover with Supervised Classification
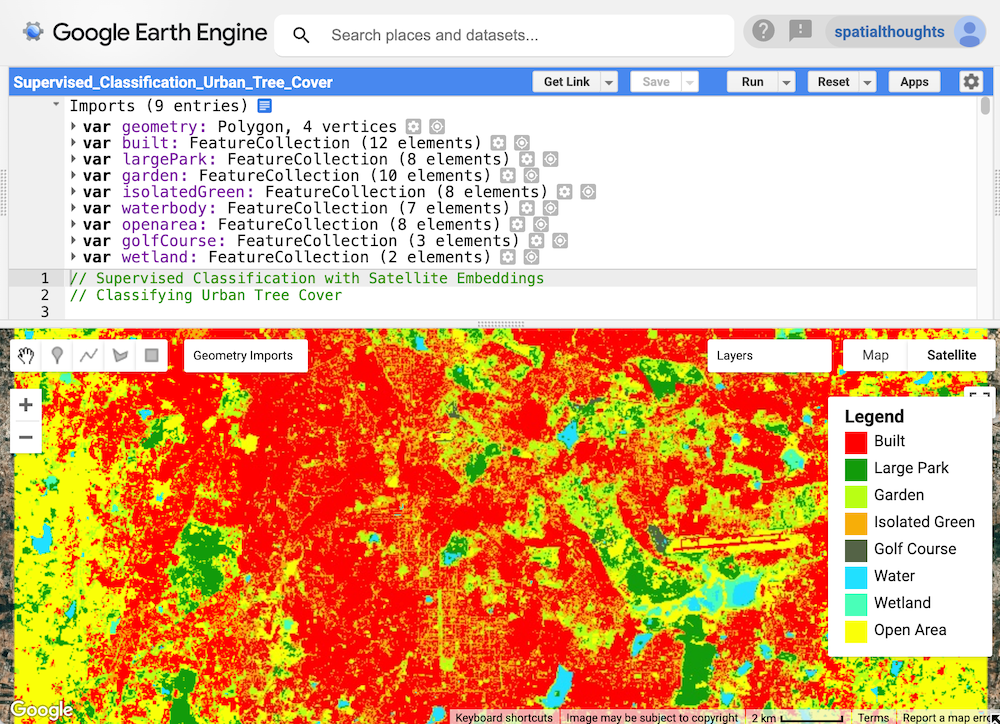
Mapping Different Types of Vegetation with Embeddings
// Supervised Classification with Satellite Embeddings
// Classifying Urban Tree Cover

// Credit: Training samples are adapted from original work by
// Nishalini, Shweta, Raj Bhagat P, Janhavi Mane, Jyoti
// for the 'Urban True Tree Cover Project'
// ****************************************************

// Select a region
// ****************************************************

// Draw a polygon to define the region
// Save it as the variable 'geometry'
Map.centerObject(geometry, 12);

// Collect Training Samples
// ****************************************************

// Pick a year for classification
var year = 2024;
var startDate = ee.Date.fromYMD(year, 1, 1);
var endDate = startDate.advance(1, 'year');

// Create a Sentinel-2 Compsite for the selected year
// for selecting training samples
var s2 = ee.ImageCollection('COPERNICUS/S2_SR_HARMONIZED');
var filteredS2 = s2
  .filter(ee.Filter.date(startDate, endDate))
  .filter(ee.Filter.bounds(geometry));

// Use the Cloud Score+ collection for cloud masking
var csPlus = ee.ImageCollection('GOOGLE/CLOUD_SCORE_PLUS/V1/S2_HARMONIZED');
var csPlusBands = csPlus.first().bandNames();
var filteredS2WithCs = filteredS2.linkCollection(csPlus, csPlusBands);

function maskLowQA(image) {
  var qaBand = 'cs';
  var clearThreshold = 0.6;
  var mask = image.select(qaBand).gte(clearThreshold);
  return image.updateMask(mask);
}

var filteredS2Masked = filteredS2WithCs
  .map(maskLowQA)
  .select('B.*');

// Create a median composite of cloud-masked images
var composite = filteredS2Masked.median();

// Display the input composite in false color
// that helps distinguish between
// water, vegetation and built surfaces
var rgbVis = {min: 300, max: 4000, bands: ['B4', 'B3', 'B2']};

Map.addLayer(composite.clip(geometry), rgbVis, 'S2 Composite (RGB)', false);

// Merge the collected training samples
var gcps = built.merge(largePark).merge(garden)
  .merge(isolatedGreen).merge(waterbody)
  .merge(openarea).merge(golfCourse).merge(wetland);

// Train a Classifier
// ****************************************************

// Sample Embedding Vectors
var embeddings = ee.ImageCollection('GOOGLE/SATELLITE_EMBEDDING/V1/ANNUAL');

var embeddingsFiltered = embeddings
  .filter(ee.Filter.date(startDate, endDate))
  .filter(ee.Filter.bounds(geometry));

var embeddingsImage = embeddingsFiltered.mosaic();

// Take mean values for each polygon
var training = embeddingsImage.reduceRegions({
  collection: gcps,
  reducer: ee.Reducer.mean(),
  scale: 10,
  tileScale: 16
});

// Some small polygons end up with null values
training = training.filter(ee.Filter.notNull(['A00']));

// Train a classifier.
var classifier = ee.Classifier.smileKNN().train({
  features: training,
  classProperty: 'landcover',
  inputProperties: embeddingsImage.bandNames()
});

// Classify the Satellite Embedding Mosaic
// ****************************************************

var classified = embeddingsImage.classify(classifier);

// Visualize the classification
// ****************************************************

var palette = ['ff0000','129b0a','b9ff14','f7ae08','21e0ff','faff08', '546346', '#49ffb8'];
var viz_class = {
  'min':1,
  'max':8,
  'palette': palette
};
Map.addLayer(classified.clip(geometry), viz_class, 'Classified');

// Add a Legend
var legend = ui.Panel({style: {position: 'middle-right', padding: '8px 15px'}});

var makeRow = function(color, name) {
  var colorBox = ui.Label({
    style: {color: '#ffffff',
      backgroundColor: color,
      padding: '10px',
      margin: '0 0 4px 0',
    }
  });
  var description = ui.Label({
    value: name,
    style: {
      margin: '0px 0 4px 6px',
    }
  });
  return ui.Panel({
    widgets: [colorBox, description],
    layout: ui.Panel.Layout.Flow('horizontal')}
)};

var title = ui.Label({
  value: 'Legend',
  style: {fontWeight: 'bold',
    fontSize: '16px',
    margin: '0px 0 4px 0px'}});

legend.add(title);

var palette = ['ff0000','129b0a','b9ff14','f7ae08','21e0ff','faff08'];
var classes = ['Built', 'National Parks', 'Garden', 'Isolated Green',
  'Water', 'Open Area', 'Golf Course', 'Wetland'];


legend.add(makeRow('#ff0000','Built'));
legend.add(makeRow('#129b0a','Large Park'));
legend.add(makeRow('#b9ff14','Garden'));
legend.add(makeRow('#f7ae08','Isolated Green'));
legend.add(makeRow('#546346','Golf Course'));
legend.add(makeRow('#21e0ff','Water'));
legend.add(makeRow('#49ffb8','Wetland'));
legend.add(makeRow('#faff08','Open Area'));

Map.add(legend);
Clustering Polygons with Embeddings
We can calculate mean value of satellite embeddings within each polygon of a layer and cluster them based on similarity. This approach is useful to group regions by similarity. In the example below, we use the US Census Blocks dataset and cluster the blocks within a city based on satellite embeddings.
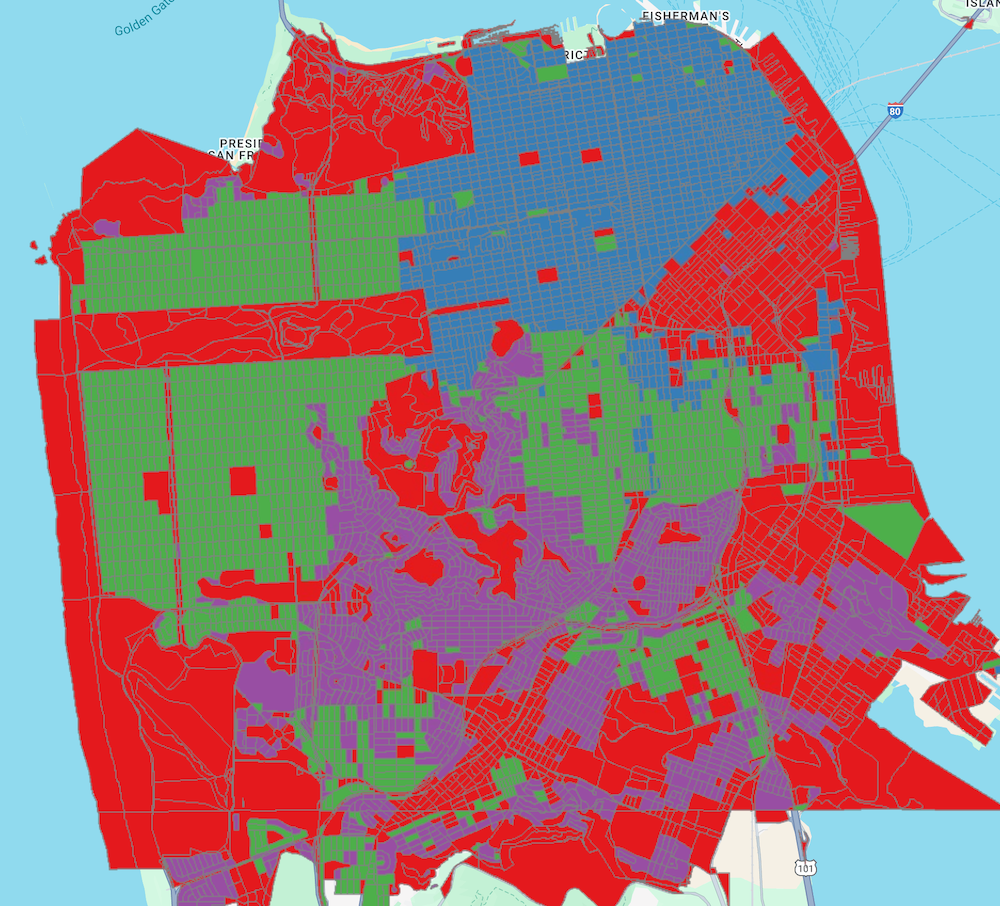
Clustered Census Blocks by Mean Satellite Embeddings
// Define the region of interest
// ****************************************************
var geometry = ee.Geometry.Polygon([[
  [-122.52522060075472, 37.809268346871846],
  [-122.52522060075472, 37.6947146252536],
  [-122.3590523878641, 37.6947146252536],
  [-122.3590523878641, 37.809268346871846]
]]);

// Prepare the Census Blocks dataset
// ****************************************************
var blocks = ee.FeatureCollection("TIGER/2010/Blocks");
Map.centerObject(geometry);

// Filter blocks that are contained within the selected AOI
var filteredBlocks = blocks.filter(ee.Filter.isContained('.geo', geometry));

// Prepare the Satellite Embedding dataset
// ****************************************************
var embeddings = ee.ImageCollection('GOOGLE/SATELLITE_EMBEDDING/V1/ANNUAL');
var year = 2024;
var startDate = ee.Date.fromYMD(year, 1, 1);
var endDate = startDate.advance(1, 'year');

var filteredEmbeddings = embeddings
  .filter(ee.Filter.date(startDate, endDate))
  .filter(ee.Filter.bounds(geometry));

var embeddingsImage = filteredEmbeddings.mosaic();

print('Satellite Embeddings Image', embeddingsImage);

// Calculate mean embeddings for each block
// ****************************************************
var blocksWithEmbedding = embeddingsImage.reduceRegions({
  collection: filteredBlocks,
  reducer: ee.Reducer.mean(),
  scale: 10,
  tileScale: 16,
});

print('Block with mean embedding', blocksWithEmbedding.first());

// printing will only work for a small region
// Export the results as Asset first and visualize the results

// ~~~~~~~~~~~~~~~~~~~~~~~~~~~~~~~~~~~~~~~~~~~~~~~~~~~~
// Export samples to an asset (optional)
// ~~~~~~~~~~~~~~~~~~~~~~~~~~~~~~~~~~~~~~~~~~~~~~~~~~~~

// Replace this with your asset folder
// The folder must exist before exporting
var exportFolder = 'projects/spatialthoughts/assets/satellite_embedding/';

var embeddingExportFc = 'sf_blocks_embeddings';
var embeddingExportFcPath = exportFolder + embeddingExportFc;

Export.table.toAsset({
  collection: blocksWithEmbedding,
  description: 'Mean_Embedding_Census_Blocks',
  assetId: embeddingExportFcPath
});


// Wait for the export to complete and continue with
// the exported asset from here onwards.

// Use the exported asset
var blocksWithEmbedding = ee.FeatureCollection(embeddingExportFcPath);

// Train a clusterer using ee.Cluster algorithms
// Optionally, export the data as a CSV and use clustering algorithms
// from R or Python packages
var numClusters = 5;

var clusterer = ee.Clusterer.wekaKMeans({
  nClusters: numClusters}).train({
  features: blocksWithEmbedding,
  inputProperties: embeddingsImage.bandNames()
});

var blocksWithClusters = blocksWithEmbedding.cluster(clusterer);
print('Blocks with cluster', blocksWithClusters.first());


// Create an empty image into which to paint the features.
var empty = ee.Image().byte();

// use paint() to color image with the values from the
// 'cluster' column
var sfBlocksClusters = empty.paint({
  featureCollection: blocksWithClusters,
  color: 'cluster',
});

// If you change number of clusters, update the palette
// and min/max values accordingly
var palette = ['#e41a1c','#377eb8','#4daf4a','#984ea3','#ff7f00'];

var visParams = {min:1, max:5, palette: palette};
Map.addLayer(sfBlocksClusters.clip(geometry), visParams, 'Clusters from Embeddings');

// Render the block boundaries for reference
var sfBlocksOutline = empty.paint({
  featureCollection: blocksWithClusters,
  color: 1,
  width: 0.5
});
Map.addLayer(sfBlocksOutline.clip(geometry), {max:1, palette: ['gray']}, 'Block boundaries', false);
Learning Resources
- Official Tutorials in Google Earth Engine User Guide
Data Credits
- Satellite Embedding V1: The AlphaEarth Foundations Satellite Embedding dataset is produced by Google and Google DeepMind.
- Sentinel-2 Level-1C, Level-2A: Contains Copernicus Sentinel data.
- FAO GAUL 500m: Global Administrative Unit Layers 2015, Second-Level Administrative Units: Source of Administrative boundaries: The Global Administrative Unit Layers (GAUL) dataset, implemented by FAO within the CountrySTAT and Agricultural Market Information System (AMIS) projects.
References
- Brown, C. F., Kazmierski, M. R., Pasquarella, V J., Rucklidge, W. J., Samsikova, M., Zhang, C., Shelhamer, E., Lahera, E., Wiles, O., Ilyushchenko, S., Gorelick, N., Zhang, L. L., Alj, S., Schechter, E., Askay, S., Guinan, O., Moore, R., Boukouvalas, A., & Kohli, P.(2025). AlphaEarth Foundations: An embedding field model for accurate and efficient global mapping from sparse label data. arXiv preprint arXiv.2507.22291. https://arxiv.org/abs/2507.22291
- Sherrie Wang, George Azzari, David B. Lobell, Crop type mapping without field-level labels: Random forest transfer and unsupervised clustering techniques, Remote Sensing of Environment, Volume 222, 2019, Pages 303-317, ISSN 0034-4257, https://doi.org/10.1016/j.rse.2018.12.026.
- Houriez, L., Pilarski, S., Vahedi, B., Ahmadalipour, A., Scully, T. H., Aflitto, N., Andre, D., Jaffe, C., Wedner, M., Mazzola, R., Jeffery, J., Messinger, B., McGinley-Smith, S., & Russell, S. (2025, August). Scalable geospatial data generation using AlphaEarth foundations model (arXiv:2508.11739). arXiv. https://arxiv.org/abs/2508.11739
- Cordeiro, M. C. R.; Martinez, J.-M.; Peña-Luque, S. Automatic Water Detection from Multidimensional Hierarchical Clustering for Sentinel-2 Images and a Comparison with Level 2A Processors.Remote Sensing of Environment 2021, 253, 112209. https://doi.org/10.1016/j.rse.2020.112209.
License
The course material (text, images, presentation, videos) is licensed under a Creative Commons Attribution 4.0 International License.
The code (scripts, Jupyter notebooks etc.) is licensed under the MIT License. For a copy, see https://opensource.org/licenses/MIT
Kindly give appropriate credit to the original author as below:
Copyright © 2025 Ujaval Gandhi www.spatialthoughts.com
Citing and Referencing
You can cite the course materials as follows
- Gandhi, Ujaval, 2025. Satellite Embedding Deep Dive workshop. Spatial Thoughts. https://courses.spatialthoughts.com/gee-satellite-embedding.html
If you want to report any issues with this page, please comment below.